| ● シミュレーション例
|
| [スクリプトの作成例] |
|
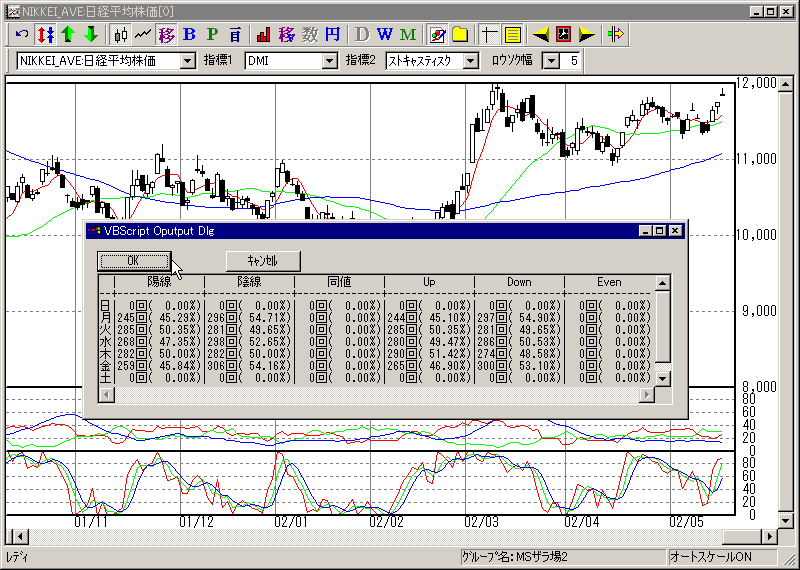
・曜日毎の、「陰陽線の発生回数と割合」、「前日終値に対する当日終値の上下回数と割合」を集計してダイアログに表示するITicker用のスクリプトを作成してみました。
|

|
その他にも、値幅の積算等も加えると面白いかもしれません。後は皆さんの工夫次第です。
◎以下のような操作を行えば、下記サンプルスクリプトがそのまま実行出来ます。
|
-
マウスで「'//スクリプト開始」〜「'//スクリプト終わり」までを選択
-
右クリック→コピー(C)でクリップボードにコピー
-
メモ帳などのテキストエディターに貼り付け
-
名前はなんでも構いませんが、拡張子を必ずitcにして保存。
(*メモ帳で保存する場合は、ファイルの種類を必ず「すべてのファイル」に指定して拡張子itcを付けて保存して下さい。)

-
ITickerからチャートを開き、
 をクリック。 をクリック。
-
選択のダイアログから保存したファイルを選択。
|
'//スクリプト開始
Option Explicit '変数の明示的な宣言を強制
'//////////////////////
'//関数の定義
'//
'表示を見やすくするため桁数によってスペースを挿入
Function AddSP(data)
If data < 10 And data >= 0 Then
AddSP = " " & data
ElseIF data < 100 Then
AddSP = " " & data
Else
AddSP = "" & data
End If
End Function
'////////////////////////////
'// オブジェクト・変数の設定
'//
Dim hChart
Dim index, wday
Dim strLog
'0:日、1:月、2:火、3:水、4:木、5:金、6:土
Dim cntSum(6)
Dim cntYo(6), cntIn(6), cntDo(6), cntUp(6), cntEven(6), cntDown(6)
Dim ratioYo(6), ratioIn(6), ratioDo(6), ratioUp(6), ratioEven(6), ratioDown(6)
Dim strWDay(6)
strWDay(0) = "日"
strWDay(1) = "月"
strWDay(2) = "火"
strWDay(3) = "水"
strWDay(4) = "木"
strWDay(5) = "金"
strWDay(6) = "土"
For wday = 0 To 6
cntSum(wday) = 0
cntYo(wday) = 0
cntIn(wday) = 0
cntDo(wday) = 0
cntUp(wday) = 0
cntEven(wday) = 0
cntDown(wday) = 0
ratioYo(wday) = FormatNumber(Round(0.0, 2), 2)
ratioIn(wday) = FormatNumber(Round(0.0, 2), 2)
ratioDo(wday) = FormatNumber(Round(0.0, 2), 2)
ratioUp(wday) = FormatNumber(Round(0.0, 2), 2)
ratioEven(wday) = FormatNumber(Round(0.0, 2), 2)
ratioDown(wday) = FormatNumber(Round(0.0, 2), 2)
Next
'時系列データオブジェクトITObjHistDataを作成
Set hChart = ITCreateObjHistData
'///////////////////////////
'// 判定・カウント
'//
hChart.SetCurrentChart '現在開いているチャートの時系列データを取得
For index = 1 To hChart.GetCnt-1
'曜日番号の取得
wday = Weekday(hChart.GetDate(index)) - 1
'陰陽線の判定・カウント
If hChart.GetOpen(index) > hChart.GetClose(index) Then
cntIn(wday) = cntIn(wday) + 1
ElseIf hChart.GetOpen(index) < hChart.GetClose(index) Then
cntYo(wday) = cntYo(wday) + 1
Else
cntDo(wday) = cntDo(wday) + 1
End If
'前日比の判定・カウント
If hChart.GetClose(index-1) > hChart.GetClose(index) Then
cntDown(wday) = cntDown(wday) + 1
ElseIf hChart.GetClose(index-1) < hChart.GetClose(index) Then
cntUp(wday) = cntUp(wday) + 1
Else
cntEven(wday) = cntEven(wday) + 1
End If
cntSum(wday) = cntSum(wday) + 1
Next
strLog = " | 陽線 | 陰線 | 同値 | Up | Down | Even " & vbNewLine & _
"--+--------------+--------------+--------------+--------------+--------------+--------------" & vbNewLine
For wday = 0 To 6
If cntSum(wday) <> 0 Then
ratioYo(wday) = FormatNumber(Round(cntYo(wday)/cntSum(wday) * 100, 2), 2)
ratioIn(wday) = FormatNumber(Round(cntIn(wday)/cntSum(wday) * 100, 2), 2)
ratioDo(wday) = FormatNumber(Round(cntDo(wday)/cntSum(wday) * 100, 2), 2)
ratioUp(wday) = FormatNumber(Round(cntUp(wday)/cntSum(wday) * 100, 2), 2)
ratioEven(wday) = FormatNumber(Round(cntEven(wday)/cntSum(wday) * 100, 2), 2)
ratioDown(wday) = FormatNumber(Round(cntDown(wday)/cntSum(wday) * 100, 2), 2)
End if
strLog = strLog & strWDay(wday) & "|" & _
AddSP(cntYo(wday)) & "回(" & AddSP(ratioYo(wday)) & "%)|" & _
AddSP(cntIn(wday)) & "回(" & AddSP(ratioIn(wday)) & "%)|" & _
AddSP(cntDo(wday)) & "回(" & AddSP(ratioDo(wday)) & "%)|" & _
AddSP(cntUp(wday)) & "回(" & AddSP(ratioUp(wday)) & "%)|" & _
AddSP(cntDown(wday)) & "回(" & AddSP(ratioDown(wday)) & "%)|" & _
AddSP(cntEven(wday)) & "回(" & AddSP(ratioEven(wday)) & "%)" & _
vbNewLine
Next
ITMsgBox strLog
'//
'// スクリプト終わり
|
|
|
